Tens of thousands were asked in a Census survey:
Do you use the Internet to access government services, forms, or information? (Including tax forms.)
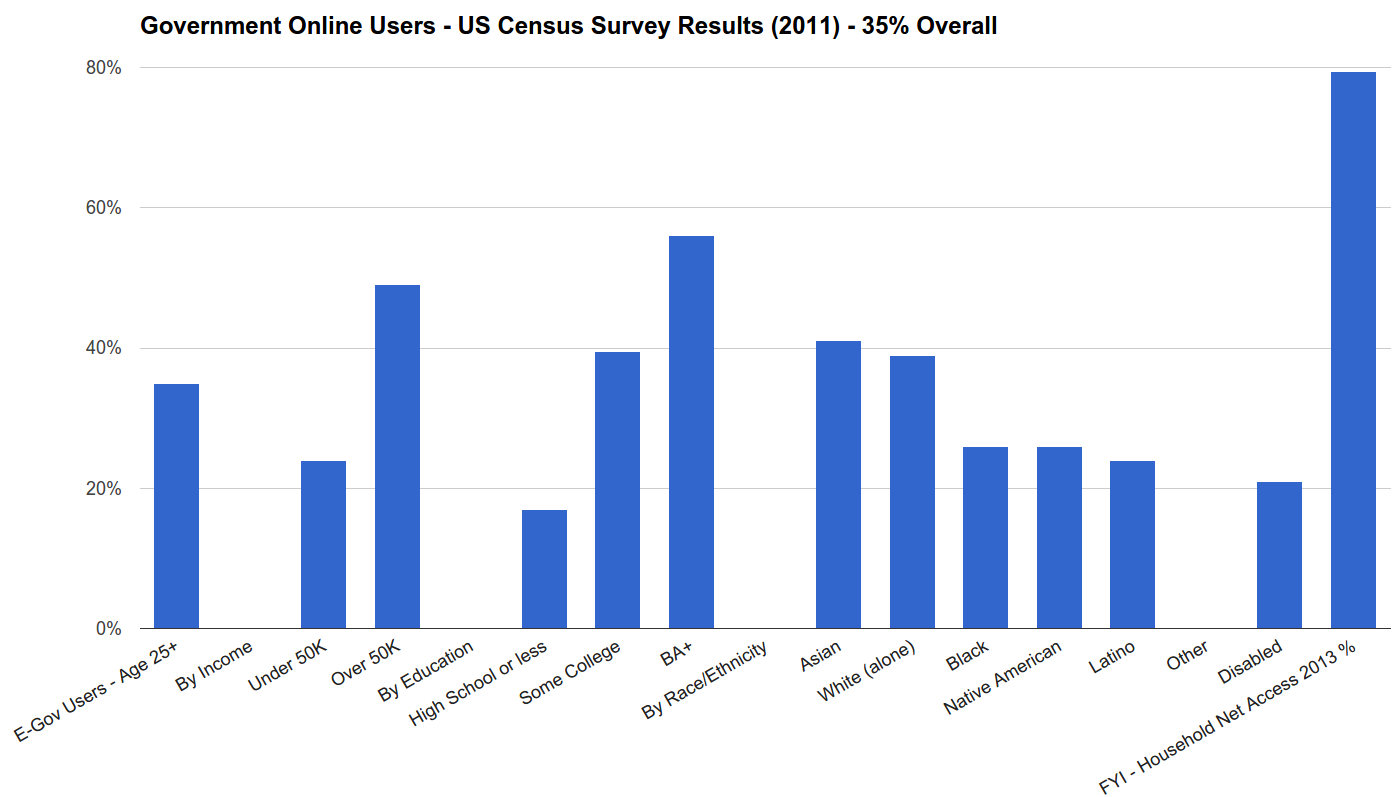
Here is who over 25 years old who said “Yes”:
We’ve discovered a little known Census survey question on e-government buried on page 161 of the tables supporting the NTIA’s 2013 Digital Nation report. Never before have so many people been surveyed on their use of digital government.
While the survey was asked in 2011, fresh numbers from 2013 are about to be released. Let’s not miss this opportunity for timely learning.
With over 53,000 households surveyed you can slice and dice this data by state, demographics, and more. Thanks to some help converting NTIA produced tables, I can now share some national demographic stats in easier to understand percentages.
In summary …
- 35% said they use government services online (household respondents over age 25)
- Households over 50K in income use e-government at twice the level of those under 50K – 49% versus 24%
- Gaps based on education are larger than income – 17% for High School or less versus 56% for those with a BA
- Gaps based on race/ethnicity are significant. (The chart above for Whites is white, non-Hispanic)
- In the just released 2013 ACS survey, which included Internet questions for the first time, 21.5% of households report no Internet access (including no use via libraries, mobile devices, etc.) – so depending upon the pending 2013 numbers and e-gov use growth/decline, more that half of Internet using households are likely NOT accessing government online. Yikes!
- See the chart above or this simple Google presentation for more.
Our inclusion analysis of the digital civic engagement report by Pew is one of our most popular blog posts in our 20 year history, so the demand for deeper analysis about potential growth audiences for civic/government digital engagement is there.
At the recent (and awesome) Code for America Summit, I was struck how the growing “inclusion” discussion was more about input into design or engagement in civic tech efforts (important “Build with, not for” theme) but not so much about effective outreach to broader, more representative use online.
Without a strong awareness of our baseline numbers about who is NOT yet being reached by open gov/civic tech/e-gov, how do we target our scarce resources to have the greatest impact? Put another way, if we only serve “those who already show up” with e-government, e-democracy, civic tech, etc., how is that making a dramatically positive digital difference in the world?
- State Rankings – We are drafting state rankings based on e-gov use overall, e-gov use as a percentage of those online.
-
- Teaser – Washington State kicks butt overall. Some states that rank high in net access serve relatively few with e-government, while Montana despite lower levels of access does great with e-government use.
- Why More Successful – In addition to national demographic analysis, we see an opportunity to determine which states are reaching a higher percentage of lower income residents online with e-government/civic tech AND then commission research that asks why are they successful. We can then suss out lessons to share with governments and others across the states. Ultimately, e-government needs to reach far more people and understand who is not using their services and why.
- More Numbers – 2013 numbers are coming out soon from the Census Department – contact us to volunteer your data analysis/visualization skills or join the proposed New Voices working group and/or Digital Inclusion online group – to get involved.
- More Questions – A different Census survey question that feeds the Civic Health Index asks about using the “Internet 
to 
express 
your 
opinions
 about
 political or community 
issues.” We’d like to add this to our analysis.
- Gather Leading Examples, Feed them Numbers – Even if we’ve figured out how to make it much easier to apply for food stamps online, build it and they won’t just come. We need to convene those building civic and public sector tech to reach or engage those being least served. Together we can plot outreach strategies to bring these service designed innovations to a far wide audience.
This is important information and a great example of using data to help build understanding of a serious problem. It would be great to see another set of reports that tell us how many people actually see this information, how many share it in groups so others see the information, and how this leads to increasing internet access to those who don’t have access, and how it leads to increasing use of digital information resources by those who currently use it far less than others.